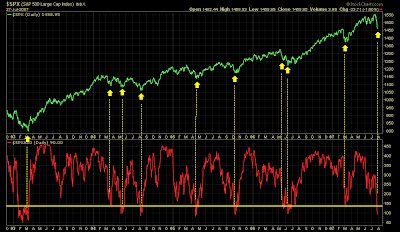
Number Of Stocks Above Their 50 Day Moving Average

Above is a five year daily chart of the S&P...In the lower pane is an indicator that shows the amount of stocks trading above their 50 day moving average.
As you can see, whenever the amount of stocks trading above their 50 day average is less than 140, the stock market bottoms and a rally follows. Right now this indicator is suggesting that the market is close to putting in a bottom.
I think the best way to use this indicator is to let the indicator fall below 140 and then turn back up above 140, that's when you buy.
Look at the above chart very carefully, I'll let you decide if it's of any value or not.


![[Most Recent Charts from www.kitco.com]](http://www.kitconet.com/charts/metals/gold/t24_au_en_usoz_4.gif)
![[Most Recent Charts from www.kitco.com]](http://www.kitconet.com/charts/metals/silver/t24_ag_en_usoz_4.gif)
![[Most Recent Exchange Rate from www.kitco.com]](http://www.weblinks247.com/exrate/24hr-euro-small.gif)


 stocks
trading
3 comments:
Yes, I do believe that it has relevance....
and...enjoy your travels !
guys BULL RUN will not stop until 2010 everything else is NOISE
One comment about this chart. You are only showing a bull market run here. What happens during a longterm correction, or what happens/how do you know, when the bull run is at an end? I have a feeling that you will say that this only works in an uptrend, as the chart shows. Just a thought.
Post a Comment