Showing posts with label Forex. Show all posts

Wednesday, March 03, 2010

Japanese Yen Update


A few weeks ago I was bearish on the Japanese Yen looking for this currency to continue moving lower but as you can see that view was clearly wrong. Today the Japanese Yen made a 2 month high posting its highest close since mid December 2009.

As of now I have no clear opinion on the Japanese Yen as this currency has been in a trading range for the past few months. I will say however that there is no reason to still be short this currency given today's close.

Wednesday, February 17, 2010

Japanese Yen - Sell Signal


Above is a daily chart of the Japanese Yen and in the lower panel is the MACD indicator. You'll notice today the MACD issued a sell signal at the same time price has broken its short term uptrend (red line). Many of the MACD crossings over the past few months on the above chart have been reliable.

When you look at the price action over the past few months, it appears the Japanese Yen is putting in a lower swing high. If I am right about this lower high, we should see the Yen make a lower low. My downside objective for the Japanese Yen is the 103 area.

Wednesday, January 27, 2010

Canadian And Australian Dollar Update


Last week the Canadian and Australian dollar both tested resistance and failed to break through. It now appears that a rather large double top formation is beginning to take shape. Both currencies have broken their uptrend lines confirming a top. We'll see if the selling continues.

Wednesday, January 06, 2010

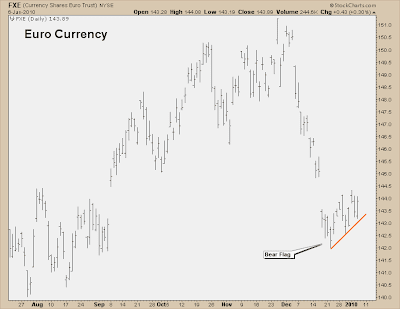
Euro Currency - Bear Flag


Last month the Euro dropped quite a bit and is now consolidating forming what is known as a bear flag. A close below the trendline will confirm the pattern and suggest further weakness. A move above last week's high would negate the pattern.

Tuesday, December 22, 2009

Euro Currency Update


The Euro continues to fall and is rapidly approaching the one third retracement level of the bull market which began last March. I've been bearish on this currency since the beginning of this month based on technicals. You can read that post from December 6th by clicking here.

Thursday, December 17, 2009

U.S. Dollar - Movin On Up


About 2 weeks I became bullish on the dollar based purely on technical considerations. Sine then the dollar has rallied and has now broken out of its 6 month down trending channel. If you care to see that post from two weeks ago as to why I turned bullish on the greenback, you can do so by clicking here.

Tuesday, December 08, 2009

Bearish Technicals For The Australian Dollar


G'day mates. Above is a daily chart of the Australian dollar and in the lower panel is the MACD indicator. The Australian dollar has clearly broken it's uptrend line which suggests that this bull market may either consolidate or reverse. The MACD indicator in the lower panel showed bearish divergence at the highs and has now crossed giving a sell signal.

When we look at the bigger picture in the weekly chart below, we see that the weekly MACD has also just crossed giving a very timely sell signal. Many charts of various markets are showing similar technical patterns. I believe this market is in a topping phase and that lower prices can be expected for the Aussie Dollar in the weeks to come.

Thursday, November 12, 2009

Watch The U.S. Dollar


Above is a daily chart of the U.S. Dollar and in the lower pane is the RSI indicator. Notice we are seeing multiple bullish divergences in the oscillator. On its own a divergence it simply a red flag or warning which is why I never trade off of just divergences, I need to combine it with something else.

In the above chart I drew a trendline which hasn't been broken since this bear market began. By combing the breaking of this trendline with the bullish divergence, we can increase our odds of success. Watch the dollar for two closes above this trendline to confirm that this currency has put in a bottom.

In the chart below you'll notice the inverse relationship between the greenback and the stock market. Every time the dollar has bottomed it coincided with a top in the stock market. If the dollar does indeed break its trendline and heads higher, it will put pressure on stocks which would confirm my already bearish stance on stocks. Lets see how things unfold.

Friday, October 30, 2009

Forex - Has The Euro Put In A Top?


Above is a daily chart of the ETF for the Euro, symbol FXE. Last week when the Euro pushed up to new highs there was a MACD bearish divergence that developed. Now it appears that a major trendline is about to be broken. In my opinion if this currency can put in one more close below the trendline, I think that would confirm a high is in place and that the Euro should now begin some kind of sell off. Let's see what happens.

Wednesday, October 28, 2009

Has The U.S. Dollar Bottomed?


I'm keeping an eye on the U.S. Dollar because I see some interesting technical signals coming into play. Notice in the above chart that there is a MACD bullish divergence that took place last week when the dollar made new lows. There is also a very important trendline that this currency is now about to test. I think if we see 2 or 3 closes above the trendline that would confirm that a bottom has been established and that the dollar should stage some kind of a rally.

As of now I have no position in this currency but as always I like to share with my readers what I am seeing and thinking BEFORE the move happens rather than after the fact.

Wednesday, September 30, 2009

The Canadian And Australian Dollar


The Canadian Dollar bounced off of a very significant long term trendline today. You'll notice in the lower pane that the Australian dollar is making new highs. Both of these currencies are commodity sensitive and are highly correlated so I wouldn't be surprise if we see the Canadian dollar break out to a new high in the next few days.

Monday, August 10, 2009

British Pound Opens Below Support


This morning the British Pound opened below the support area forcing me to exit my long position. The Pound was off to a great start last week but quickly reversed its gains by moving back into the congestion area. I still feel the long term trend for this market is up and will continue to take buy signals and use sell signals to exit my long positions. I'll patiently wait for the next buy signal to take place.

Thursday, August 06, 2009

British Pound - Update


The British Pound sold off today after moving higher over the last 5 days. The breakout level from last month was 166 so I would expect the 166 level to provide support.

Monday, August 03, 2009

British Pound Closes Strong For a Second Day


Today the British Pound rallied putting in another strong day. I like the fact that this currency was able to close two days in a row outside of the breakout area. This in my opinion adds to the validity of the breakout being real and not a fake out. As we all know, anything can happen in the markets but seeing the pound rally the way it did today adds more fuel to the bullish argument for this particular currency.

U.S. Dollar Makes New Lows For The Year


Today we saw continued selling hit the U.S Dollar with the greenback setting a new low for the year. The symmetrical triangle forecasts a downside target of approximately 76.50 based on the widest part of the triangle subtracted from the entry price. I originally posted about this triangle formation back on July 15th. Here's the link to see what the chart looked like several weeks ago.

Friday, July 31, 2009

British Pound And Canadian Dollar Cycles


Many of you have been asking me to post some charts which shows the long term cycles for the Canadian Dollar and the British Pound so here they are. I apologize for taking so long to post these charts and respond to your emails.

Above is the 8 year cycle in the British pound and in my opinion it appears that this cycle has bottomed a few months ago and that the long term trend should be up for quite sometime. Having said that, my plan will be to take technical buy signals only and use sell signals to either take profits on longs or tighten up trailing stops on existing long positions. Technical buy signals as far as I am concerned are pullbacks and breakouts that meet my criteria.

Below is a weekly chart of the Canadian Dollar along with the approximate 11 month cycle that I've been following in real-time on this blog. This cycle has been accurate and has helped me catch some nice moves in this currency in the past. As you can see in the chart below the Canadian Dollar has already established its 11 month cycle low and has been moving higher. I totally missed buying this currency a few months ago and I feel the risk to buy it here is too high.

British Pound Breaks Through Resistance


As you know I've been following the British Pound for quite some time waiting for the breakout to the upside and it appears that is exactly what is taking place right now. The British Pound has broken out above resistance and its 2 month trading range. Notice the low ADX reading at the bottom of the chart which usually takes place just prior to a significant trending move. A move below this week's low will negate the bullish outlook that I have. Let's see what happens!

Thursday, July 23, 2009

Watch This Market


I've been following the British Pound very closely over the past few weeks and I think we are about to see a move take place. Above is a daily chart of the ETF for the British Pound (FXB) and in the lower pane is the ADX indicator. Notice how low the ADX is right now, it's below 15. If you look at the price action you will notice a solid line of resistance taking place at around the 166 level. If you look even closer at the arrows that I placed on the chart, you will notice that the lows are getting higher which tells me that buyers are entering the market. This is is similar to an ascending triangle chart pattern.

I think if the pound can close above the 166 level, that may be the beginning of an up move which might be rather large due to the 8 year cycle that dominates this currency's trends. Take a look at a long term monthly chart of the British Pound (not shown) going back 30 years and you will notice a very dominant 8 year cycle of lows which has been very accurate. In my opinion I believe that an 8 year cyclical low has been made. Only time will tell if I am right but for now I'm going to just trade what I see and let the market dictate if I enter long or not.

Wednesday, July 15, 2009

U.S. Dollar - Under selling Pressure


I just wanted to make a quick comment about the U.S. Dollar. You'll notice in the above chart that the greenback is attempting to break free of its 1 month consolidation. If the selling continues, this may provide support for some commodities such as gold and oil.

Tuesday, May 19, 2009

British Pound - New High For The Year


The British Pound made a new high for the year today and is quickly becoming one of the strongest currencies out there. If you look at the other major foreign currencies such as the Euro, Swiss Franc and Japanese Yen, you'll see that all of them have not made new highs for the year. The British Pound is without a doubt the currency that money appears to be moving into since this year began.

Money-Making Ideas

DISCLAIMER

This site may include market analysis. All ideas, opinions, and/or forecasts, expressed or implied herein, are for informational purposes only and should not be construed as a recommendation to invest, trade, and/or speculate in the markets. Trading and investing involves high levels of risk. Any investments, trades, and/or speculations made in light of the ideas, opinions, and/or forecasts, expressed or implied herein, are committed at your own risk, financial or otherwise.
 
Google
Technorati Profile Finance Blogs - Blog Top Sites