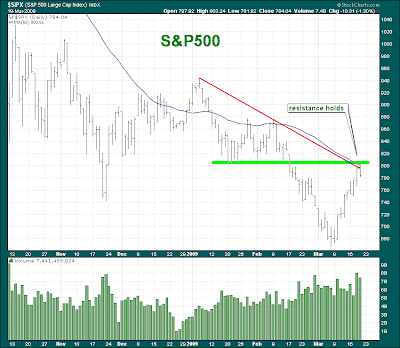
Resistance Holds In The S&P

A few days ago I wrote about the importance of the 804 area in the S&P. The reason why I thought this level was so important was because so many technical factors came into play around 804. As you can see in the above chart we have the 50 day moving average, the trendline and resistance (bright green line) all coming together at 804. There was also a 50% retracement that coincided at 804 but I didn't draw it on the chart because there would have been too many lines. The high of this move in the S&P yesterday was 803.23.
Below is a 60 minute chart of the S&P and it appears that the uptrend line has been broken today. Note the divergence in the RSI that is taking place right now. We saw a similar divergence in the RSI 2 weeks ago which warned of a rally. 
I think we will see a little pullback here in the market. How far of a pullback remains to be seen so lets just sit back and let the market do what it's going to do.


![[Most Recent Charts from www.kitco.com]](http://www.kitconet.com/charts/metals/gold/t24_au_en_usoz_4.gif)
![[Most Recent Charts from www.kitco.com]](http://www.kitconet.com/charts/metals/silver/t24_ag_en_usoz_4.gif)
![[Most Recent Exchange Rate from www.kitco.com]](http://www.weblinks247.com/exrate/24hr-euro-small.gif)


 stocks
trading
4 comments:
I know you plan to go long. What are you looking at to see whether the pullback is done? thx
Not sure about the long side because the market is having trouble getting through the 50 day moving average. Let's see what happens over the next few days. I think right now the stock market will pullback.
Hi Kevin, what makes you to go long? Is the old November low holding in the next days (750/740 on SPX) or you will wait for the market to close (in the weekly?) above 800? thx
Right now I think the market is going to sell off because the S&P could NOT get above resistance (50 day avg)so for now I will remain a little bearish. I would look to get long if I see the S&P take out resistance. Then I'd wait to buy a dip. I need to see signs of strength with follow through before I buy this market.
Post a Comment