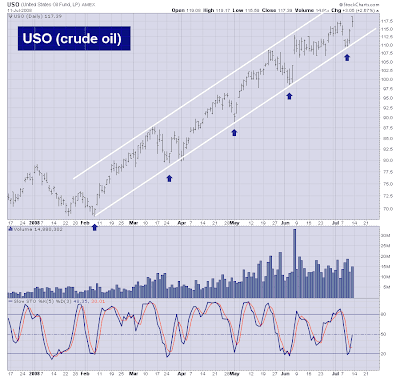
Crude Oil Holding Its Channel

I just wanted to post this chart of crude oil because I find it interesting on a technical basis.
Notice how perfectly crude oil is trading within its channel bouncing from low to high but always remaining within the channel lines. It will be interesting to see what happens when these line are broken.
Notice also how oil is making a low approximately every 5 weeks. It appears as though we're just coming off of a 5 week cyclical low which means oil may continue higher for a few more weeks..


![[Most Recent Charts from www.kitco.com]](http://www.kitconet.com/charts/metals/gold/t24_au_en_usoz_4.gif)
![[Most Recent Charts from www.kitco.com]](http://www.kitconet.com/charts/metals/silver/t24_ag_en_usoz_4.gif)
![[Most Recent Exchange Rate from www.kitco.com]](http://www.weblinks247.com/exrate/24hr-euro-small.gif)


 stocks
trading
7 comments:
Kevin,
Now that XLE has failed to take out 83.19, wil you still keep the trade on the radar or have you decided to sit out? In other words, what is your time horizon to get back into the trade?
Thanks,
Adam
There has been lots of news that crude price will ease from its high price. But I think it will still go up because the channel line is not yet broken.
HI Kevin
I think you have a interesting blog. I would like to add a link to it from my blog if you don't mind?
www.tradingwiththeaveragejay.blogspot.com
I f you get a second please take a look I could use some feedback.
Jay
hi kevin, I noticed throughout your posts that you use a few different settings on your indicators ranging from slow stochs 5 to 40 settings and williams %. Would it be possible for one of your posts to run down some of your favorite indicators and settings? I know from my own trading i use different indicators depending on if the market I'm looking at is trending or bracketed.
kevin, by the way have you seen the relative strength in the biotechs? xbi ibb bbh
Kevin,
Oil is and has been in a runaway bull move for a while now. Correction size has been $10-$12 on every correction. Usually when you see a correction that exceeds those parameters the runaway move is over.
Today we also got the 4th up day in a row. This brings into play Vic Sperandeo's 4 day corollary rule. That just says that the first counter day after 4 or more days in a row in a long intermediate move often signals a trend change.
nice blog
good continuation
Post a Comment