DISCLAIMER
This site may include market analysis. All ideas, opinions, and/or forecasts, expressed or implied herein, are for informational purposes only and should not be construed as a recommendation to invest, trade, and/or speculate in the markets. Trading and investing involves high levels of risk. Any investments, trades, and/or speculations made in light of the ideas, opinions, and/or forecasts, expressed or implied herein, are committed at your own risk, financial or otherwise.


![[Most Recent Charts from www.kitco.com]](http://www.kitconet.com/charts/metals/gold/t24_au_en_usoz_4.gif)
![[Most Recent Charts from www.kitco.com]](http://www.kitconet.com/charts/metals/silver/t24_ag_en_usoz_4.gif)
![[Most Recent Exchange Rate from www.kitco.com]](http://www.weblinks247.com/exrate/24hr-euro-small.gif)


 stocks
trading
3 comments:
Kevin,
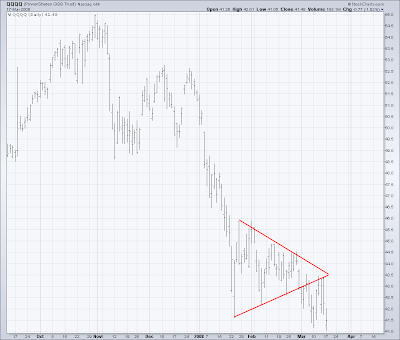
Thanks for your insight on the NASDAQ trade. Why 38 to 39? I seem to be better at picking entry points than I am at placing my stops or determining when to take profits. How did you determine the 38-39 range. And at that point to you reverse the trade and go long or wait for the market to tell you what to do?
Thanks,
John
Hi John,
My target is based on the size of the symmetrical triangle which is 4 dollars. If you subtract 4 dollars from the breakout point, you get 39 as an area to take profits.
I would not reverse my position if the market did trade down there. I'm only using the 38 to 39 area as a place to cover my short position.
WHat is your current view on the Q's? You think moving over the resistance of 44.50, is only temporary, and it will trade back down to the 38/39 area any time soon?
Post a Comment